Line Graph Worksheets
A line graph is used to show data over a period of time. We have a collection of printable line graph worksheets for you to use with your students.

Line Graph: Height FREE
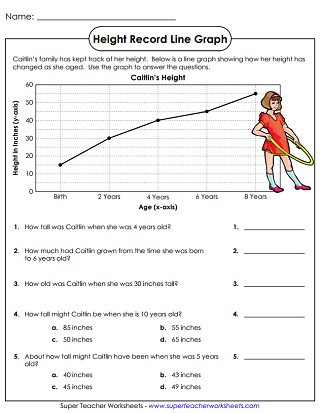
Graph of a child's height as they grow from birth to age 8; Scales count by 10s and 2s on this free worksheet; Grades 2-3
2nd and 3rd Grades
Filing Cabinet
Logged in members can use the Super Teacher Worksheets filing cabinet to save their favorite worksheets.
Quickly access your most used files AND your custom generated worksheets!
Please login to your account or become a member and join our community today to utilize this helpful feature.
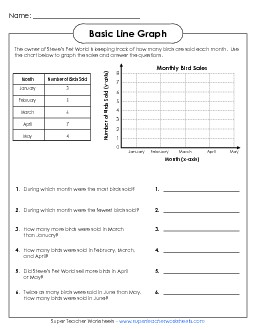
Students make a line graph showing the number birds sold at Steve's Pet World; Grades 2-3
2nd and 3rd Grades
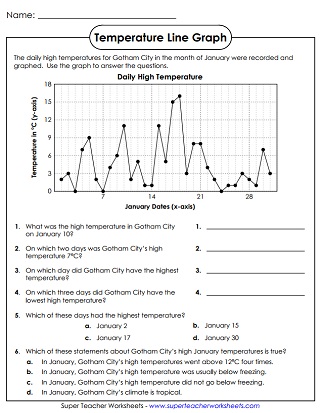
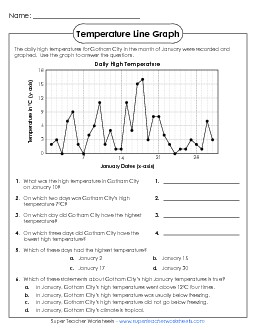
Air temperature line graph over a 1-month period; scales count by 3s and 7s on this free worksheet; Grades 4 and up
3rd and 4th Grades
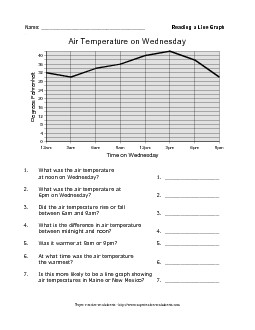
A line graph of air temperature as it changes over a 1-day period. This worksheet uses the Fahrenheit scale.
2nd through 4th Grades
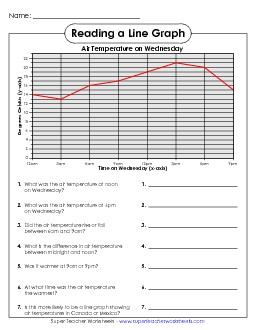
A line graph shows how air temperature changes during a 1-day period. This graph uses the Celsius temperature scale.
2nd through 4th Grades
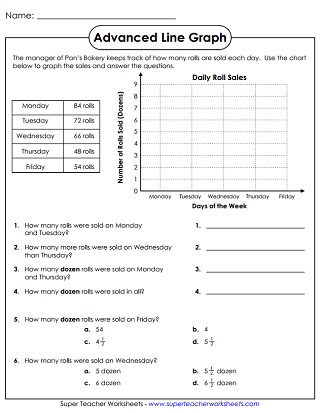
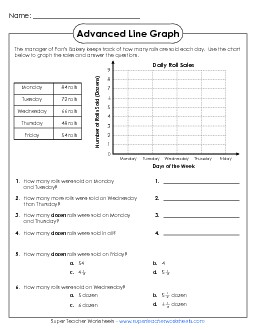
Line graph shows the number of rolls sold at Pan's bakery; Students must convert to and from dozens; Grades 4 and up
3rd and 4th Grades
The worksheets on this page contain picture graphs with symbols
Bar Graph WorksheetsPrintable bar graph worksheets with questions
Pie Graph WorksheetsA collection of circle graph (pie graph) worksheets
Line Plot WorksheetsPrint these line plot worksheets to teach frequency distribution of numbers.
