Graphing Worksheets

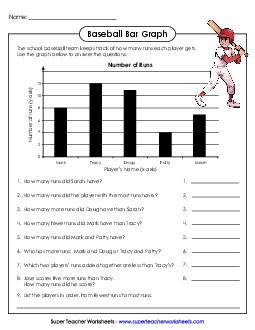
Read, create, and interpret bar graphs with these free worksheets.
Box Plots (Box-and-Whisker Plots)Create box plots on a number line using the values for Q1, median, Q3, minimum, and maximum.
(Approx grade levels: 6, 7, 8)
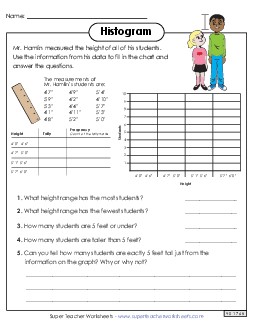
Practice reading, interpreting, and creating histograms with these printable worksheets.
Line Graph WorksheetsRead and create line graphs with these worksheets.
Line Plot (Dot Plot) WorksheetsLearn how to plot frequency of data on a number plot number line. These are sometimes called dot plots.
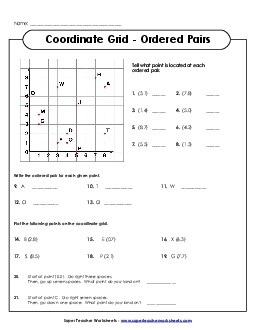
Ordered Pair WorksheetsDiscover how to plot ordered pairs on a couple free coordinate grids.
Ordered Pair Graph Art (Mystery Graph Pictures)Plot the points of the grids and connect with lines to make pictures.
Pictograph WorksheetsInterpret data on these free picture-symbol graphs worksheets.
Pie Graph WorksheetsAnalyze circle graphs, also known as pie graphs, which show fractions and percentages of a whole.
Math WorksheetsThis takes you to our full index of math worksheets.


Graphing is a key topic in elementary school math that teaches students how to visually represent and interpret data. Typically introduced in second or third grade, graphing lessons cover a variety of graph types, including bar graphs, histograms, line plots, ordered pairs, pictographs, and pie graphs. Each graph type serves a unique purpose: bar graphs compare quantities, histograms show frequency distributions, line plots track changes over time, ordered pairs plot points on a coordinate grid, and pie graphs represent parts of a whole. By learning to use these different graphs, students can effectively organize, analyze, and present data in a clear and understandable way.
In the classroom, students learn about graphing through interactive and hands-on activities. Teachers can utilize Super Teacher Worksheets' content to begin with simple exercises like creating pictographs, where students use symbols or pictures to represent quantities. As students advance, they engage in more complex tasks, such as plotting ordered pairs on a coordinate plane or creating bar graphs to compare data sets. Real-world applications, such as tracking daily weather patterns or class votes, make the lessons more engaging and relevant. Digital tools, apps, and online graphing platforms further enhance learning by providing interactive ways for students to input data and see their graphs come to life. These classroom methods make graphing accessible and enjoyable, while also reinforcing math and data analysis skills.
Understanding the core concepts of graphing is crucial for students' mathematical development. Graphs are essential tools for data visualization, helping students interpret and make sense of numerical information in an organized manner. Beyond math, graphing is widely used in subjects like science, social studies, and economics, where data analysis is key. Mastering graphing skills not only builds critical thinking and problem-solving abilities but also prepares students for future academic challenges that involve more advanced statistics and data interpretation. Graphs play a significant role in everyday life, from reading charts in the news to making informed decisions based on data, making it important for students to gain proficiency in this area early on.


