Line Plots
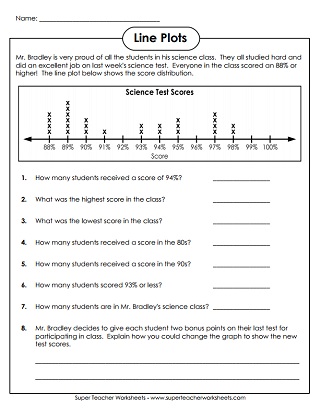
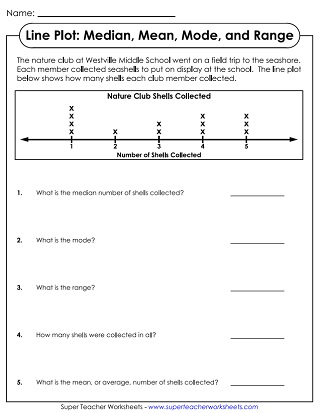
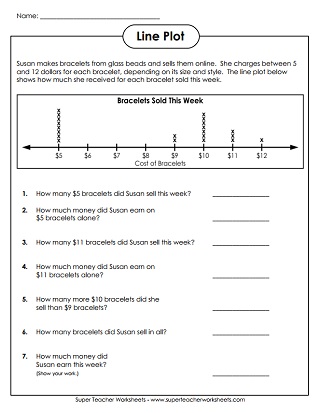
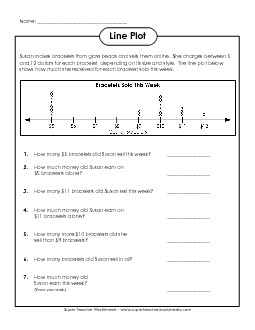
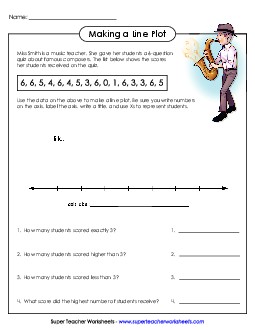
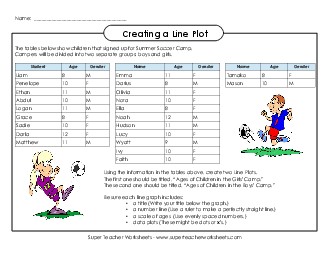
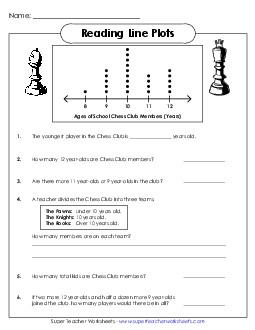
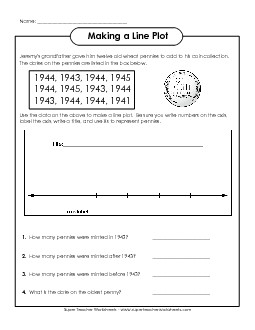
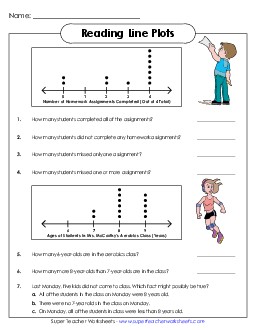
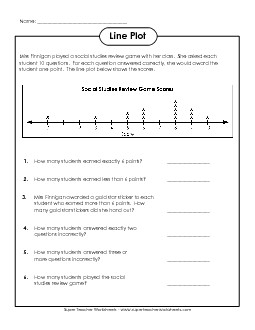
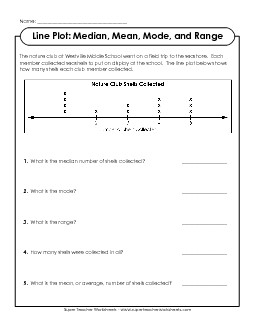
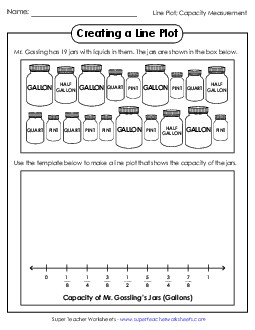
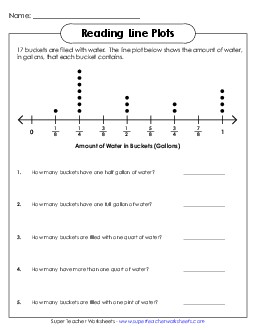
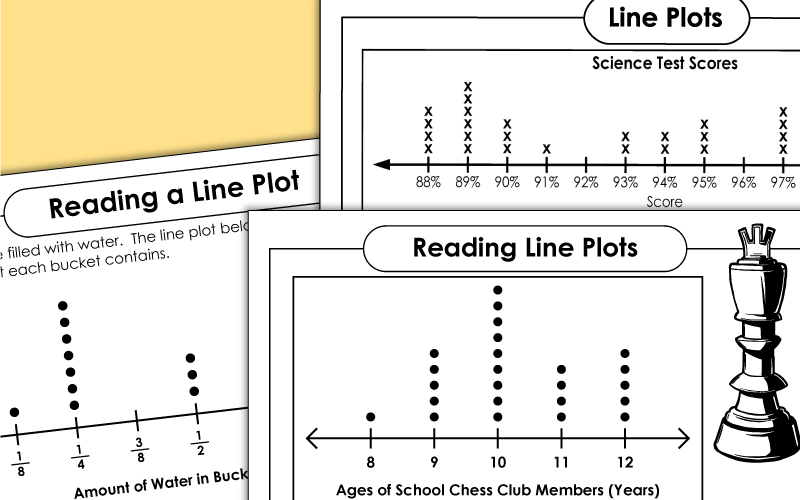
This page contains worksheets with line plots, a type of graph that shows frequency of data along a number line.
If you're looking for line graphs, please jump to the line graph worksheets page.
Logged in members can use the Super Teacher Worksheets filing cabinet to save their favorite worksheets.
Quickly access your most used files AND your custom generated worksheets!
Please login to your account or become a member and join our community today to utilize this helpful feature.
Pictographs use symbols to show data.
Line Graph WorksheetsLine graphs (not to be confused with line plots) have plotted points connected by straight lines.
Pie Graph WorksheetsPie graphs, or circle graphs, show percentages or fractions of a whole group.
Bar GraphsStudents can practice creating and interpreting bar graphs on these printable worksheets.
